平滑曲線
參考這篇文章
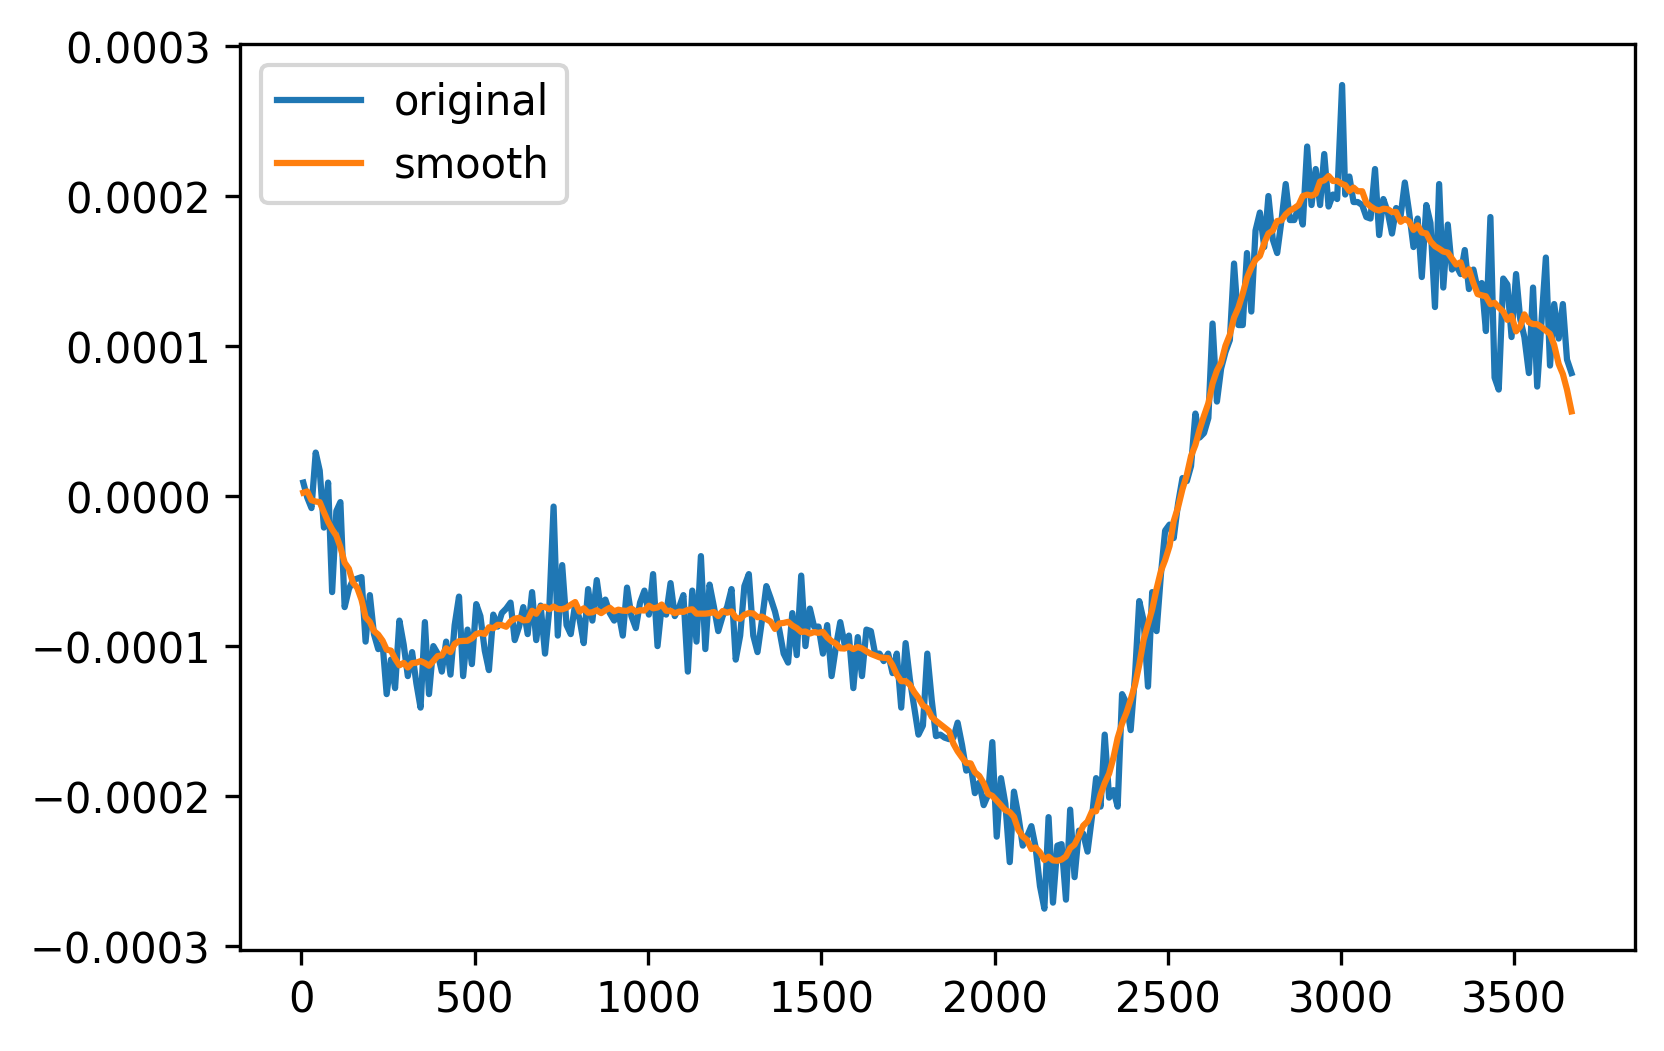
套在自己data上面大概變這樣
def moving_average(interval, windowsize):
    window = np.ones(int(windowsize)) / float(windowsize)
    re = np.convolve(interval, window, 'same')
    return re
df = pd.read_csv("PTCDA_Abs Diff.txt",sep='\t')
x = df["Field (G)"][3:]
y = df["Diff. S21_Log Mag. (dB)"][3:]
plt.figure(dpi=300, facecolor="white")
plt.plot(x,y,label="original")
y_new = moving_average(y,11)
plt.plot(x,y_new,label="smooth")
plt.legend()

Leave a Comment